The numbers are in! Premise surveyed 1,375 contributors across the U.S. to determine America’s favorite Halloween candy for 2020. Given only one vote and faced with 23 options and an “other” category, the competition was stiff for one candy to be crowned the Halloween favorite of 2020.
And the Halloween Candy Winner Goes To…
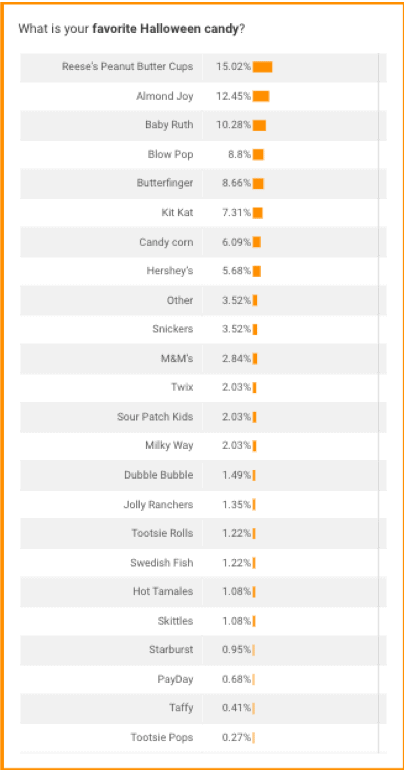 The winner came away with a 2.5 percent point lead over its challengers. Reese’s Peanut Butter Cups, gaining over 15% percent of the total vote, snagged first place. Almond Joy (12%), Baby Ruth (10%), Blow Pop (9%) and Butterfinger (9%) won the other top places in the Halloween candy ranking. The trend here is clear: consumers prefer a candy bar covered in chocolate as their Halloween treat.
What were the Halloween candy losers? Skittles, Starburst, PayDay, Taffy and Tootsie Pops each only garnered one percent or less of the vote for favorite Halloween candy. The breakdown signifies a clear preference for anything chocolate over gummy or lollipop candies.
These findings bear true for the 63% of survey participants who are planning on buying Halloween candy, of those 81% plan on purchasing some type of chocolate candy this Halloween season. This was followed by gummy candies (57%), lollipops (43%), chewing gum (25%) and “other” types of candy (16%).
Although this year has seen a record increase in the volume of online shopping, even in the face of COVID-19, 69% will shop for candy in person, with the clear majority (63%) preferring to buy candy at big box stores over drugstores or local or chain grocery stores. Only 14% will buy candy online and 17% will purchase candy both online and in-store.
What About Candy Corn?
And what about the perhaps most polarizing Halloween candy of all: candy corn? Premise asked contributors to rate their opinion of candy on a Likert scale from one (love it) to five (hate it).
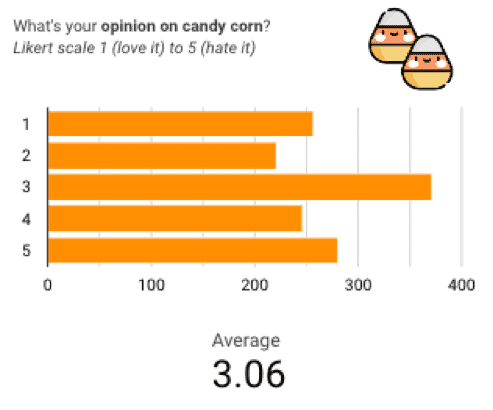 The verdict was as follows: 257 respondents selected “love it,” while 280 respondents said they “hate it.” The remaining respondents selected “like it,” “neutral” or “dislike it” values on the Likert scale. In a shocking revelation, the plurality of Premise Contributors, a total of 371 people, selected “neutral” and did not have a definitive position on the candy. Nonetheless, with an average of 3.06, slightly more people disliked the orange, yellow and white triangular candy.
Interested in using Premise to conduct market research? Email us at [email protected]. Visit us at www.premise.com/COVID-19 to follow along with our COVID-19 coverage.
Data Source: Premise Data | Data was collected between October 1-5, 2020, from 1,375 contributors. The overall survey responses allow for a 95% confidence interval with a margin of error of approximately 2.5% based on WorldPop 2020 U.S. human population data.